Note
Click here to download the full example code
Stacked bar Example#
Here shows how to draw stacked bar plot
import numpy as np
import pandas as pd

import milkviz as mv
First let’s create some random data#
data = pd.DataFrame(data=[["iPhone 12", "64G", 2200],
                          ["iPhone 12", "128G", 1200],
                          ["iPhone 12", "256G", 600],
                          ["iPhone 11", "64G", 1800],
                          ["iPhone 11", "128G", 1100],
                          ["iPhone 11", "256G", 700],
                          ["iPhone X", "64G", 3200],
                          ["iPhone X", "128G", 1200],
                          ["iPhone X", "256G", 600], ],
                    columns=['product', 'storage', 'sales'])
data
Create the stacked_bar#
mv.stacked_bar(data, group="storage", value="sales", stacked="product",
               show_values=True)
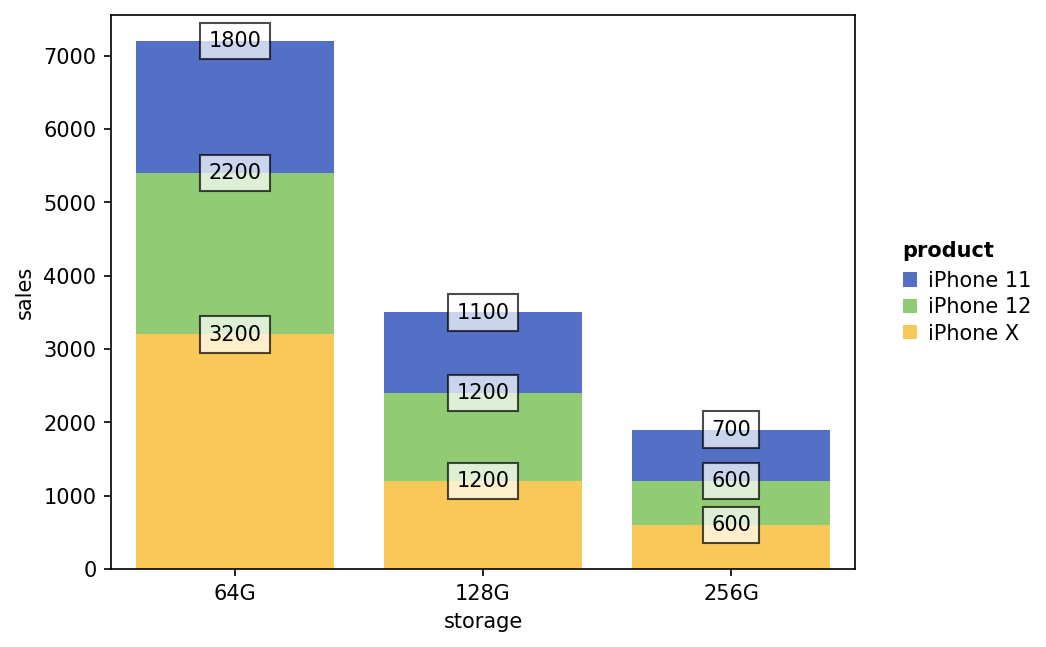
<AxesSubplot: xlabel='storage', ylabel='sales'>
Normalize the data to 1#
mv.stacked_bar(data, group="storage", value="sales", stacked="product",
               percentage=True)
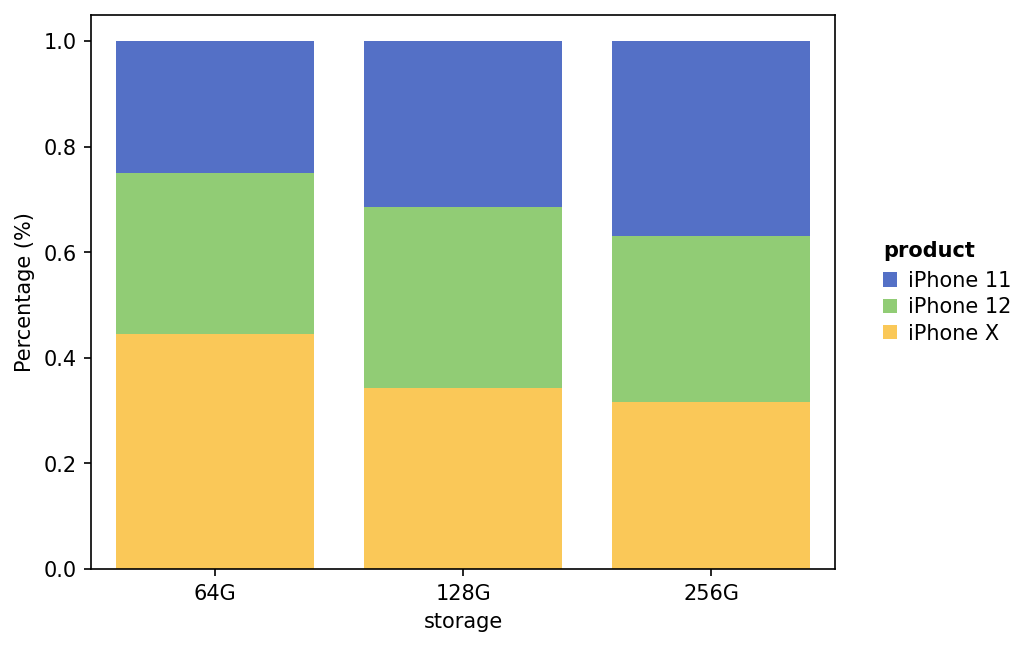
<AxesSubplot: xlabel='storage', ylabel='Percentage (%)'>
Total running time of the script: ( 0 minutes 0.903 seconds)