Note
Click here to download the full example code
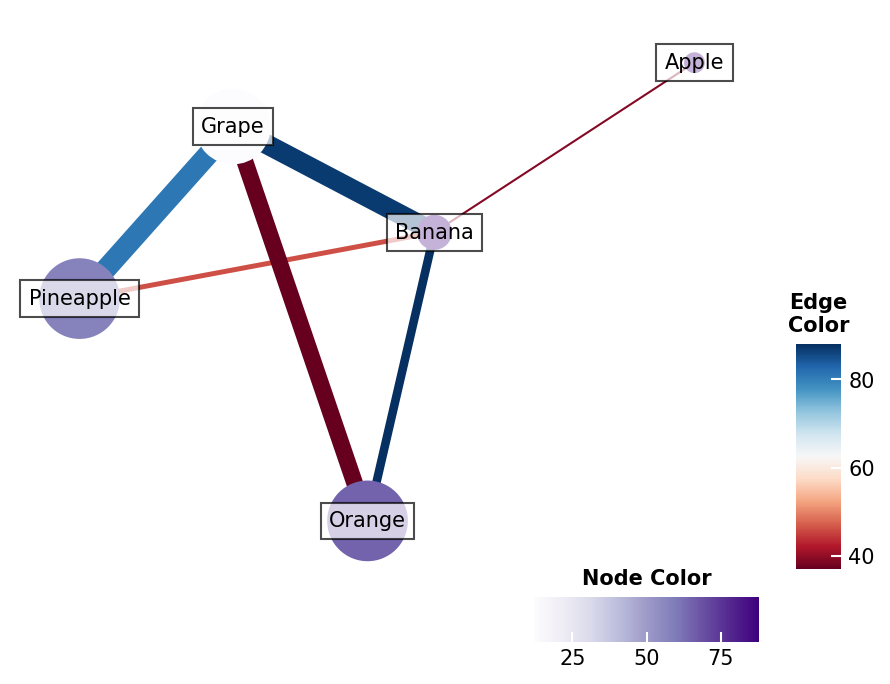
Graph plot Example#
Here shows how to draw a graph
import numpy as np
import milkviz as mv
First let’s create some random data#
nodes = ["Apple", "Banana", "Grape", "Pineapple", "Orange"]

edges = [("Apple", "Banana"), ("Banana", "Grape"),
         ("Grape", "Pineapple"), ("Banana", "Pineapple"),
         ("Banana", "Orange"), ("Grape", "Orange")]

np.random.seed(0)
nodes_size = np.random.randint(0, 100, 5).tolist()
edges_width = np.random.randint(0, 100, 6).tolist()
nodes_color = np.random.randint(0, 100, 5).tolist()
edges_color = np.random.randint(0, 100, 6).tolist()
Create the graph#
mv.graph(edges, nodes,
         nodes_size=nodes_size,
         edges_width=edges_width,
         nodes_color=nodes_color,
         edges_color=edges_color,
         node_cbar_kw={"title": "Node Color"},
         edge_cbar_kw={"title": "Edge\nColor"}
         )
<AxesSubplot: >
Total running time of the script: ( 0 minutes 0.685 seconds)