Note
Click here to download the full example code
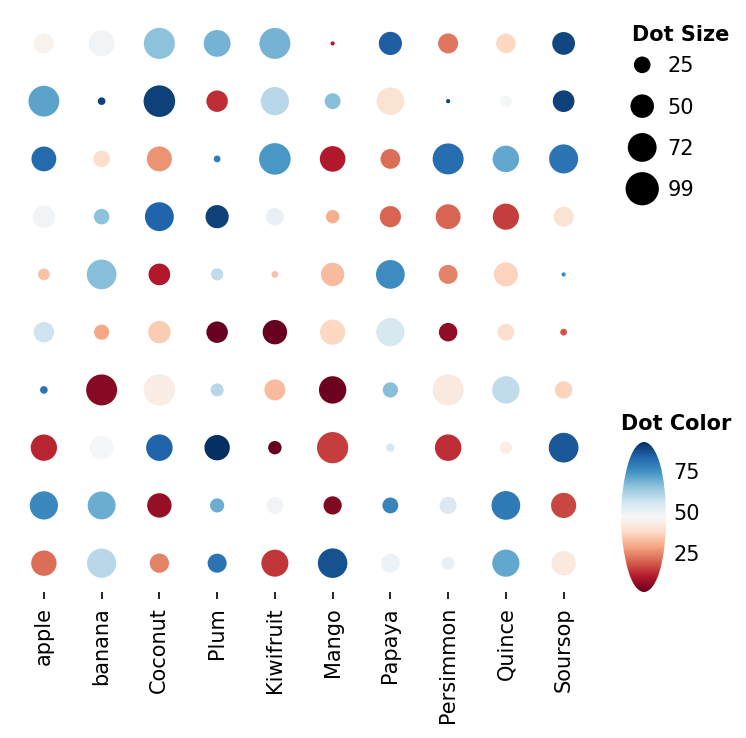
Dot heatmap Example#
Here shows how to draw dot heatmap
import numpy as np
import milkviz as mv
First let’s create some random data#
np.random.seed(0)
shape = (10, 10)
colors = np.random.randint(1, 100, shape)
sizes = np.random.randint(1, 100, shape)
matrix = np.random.randint(1, 100, shape)
labels = ["apple", "banana", "Coconut", "Plum", "Kiwifruit",
          "Mango", "Papaya", "Persimmon", "Quince", "Soursop"]
Create the dot heatmap#
mv.dot_heatmap(sizes, colors, xticklabels=labels,
               dot_size_legend_kw={"title": "Dot Size"},
               dot_hue_cbar_kw={"title": "Dot Color", "alignment": "left"},
               )
<milkviz._dot_matrix.DotHeatmap object at 0x7f2cc281d1f0>
Total running time of the script: ( 0 minutes 0.594 seconds)