Note
Click here to download the full example code
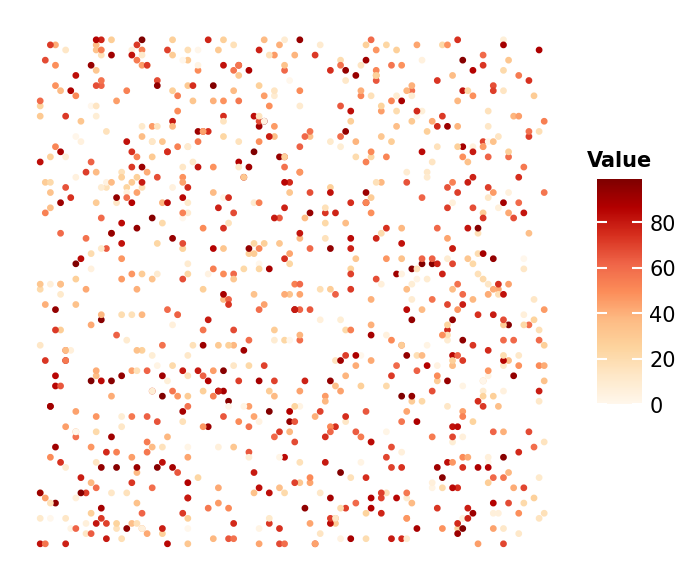
Point map Example (Continuous data)#
Here shows how to draw the point map
import numpy as np
import milkviz as mv
First let’s create some random data#
np.random.seed(0)
xy = np.random.randint(0, 100, (1000, 2))
values = np.random.randint(0, 100, 1000)
Create the cell map#
mv.point_map(xy, values=values, cbar_kw={"title": "Value"})
<AxesSubplot: >
Total running time of the script: ( 0 minutes 1.045 seconds)