Note
Click here to download the full example code
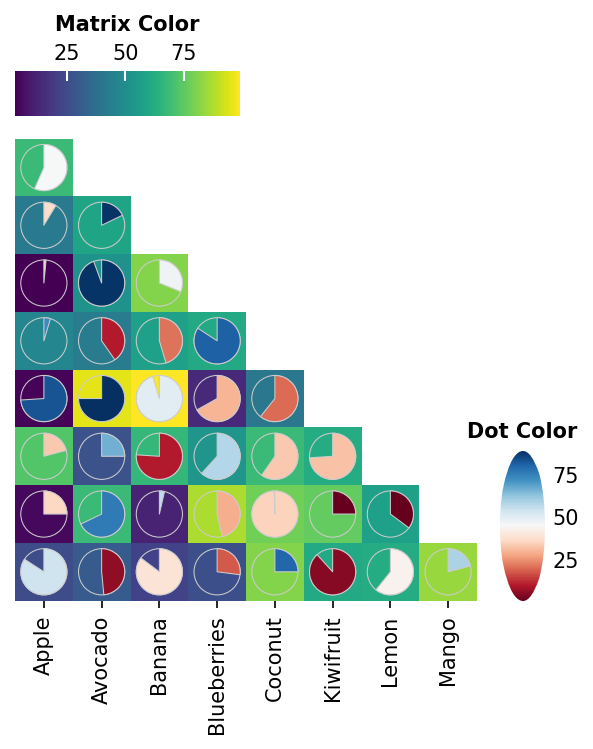
Triangle Dot heatmap Example#
Here shows how to draw a triangle dot heatmap and dot heatmap + matrix heatmap
import numpy as np
import milkviz as mv
First let’s create some random data#
np.random.seed(0)
shape = (8, 8)
colors = np.random.randint(1, 100, shape)
sizes = np.random.randint(1, 100, shape)
matrix = np.random.randint(1, 100, shape)
labels = ["Apple", "Avocado", "Banana", "Blueberries",
          "Coconut", "Kiwifruit", "Lemon", "Mango"]
Using masked array to create triangle#
You can replace all unwanted values into NaN
sizes = np.ma.masked_values(np.tril(sizes), 0)
colors = np.ma.masked_values(np.tril(colors), 0)
matrix = np.ma.masked_values(np.tril(matrix), 0)
mv.dot_heatmap(sizes, colors, matrix,
               xticklabels=labels, dot_patch="pie",
               dot_hue_cbar_kw={"title": "Dot Color"},
               matrix_cbar_kw={"title": "Matrix Color"}
               )
<milkviz._dot_matrix.DotHeatmap object at 0x7f2cb27b9280>
Total running time of the script: ( 0 minutes 0.802 seconds)