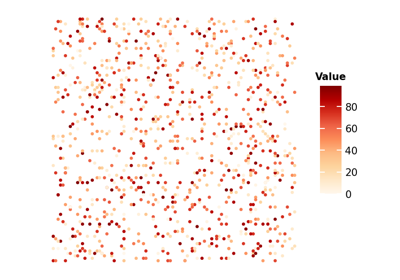
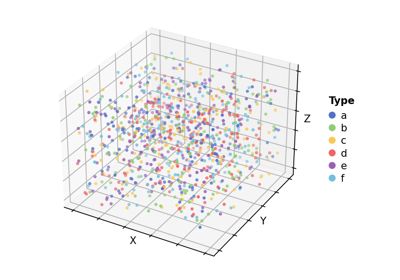
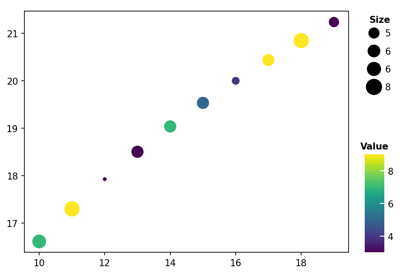
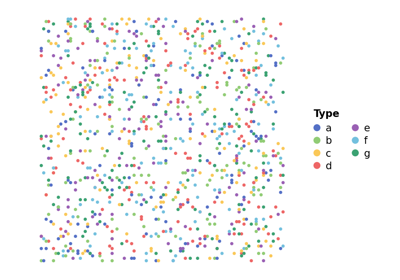
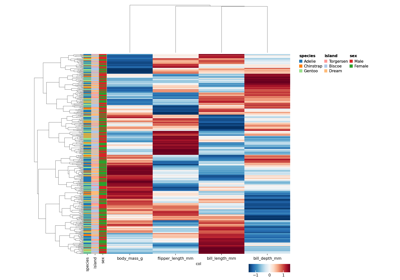
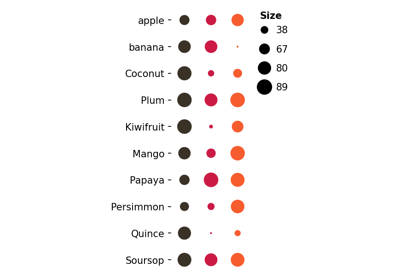
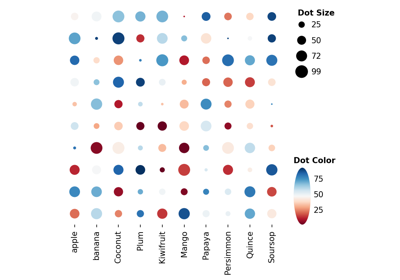
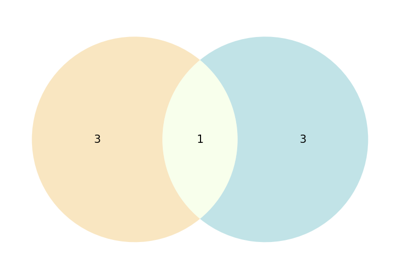
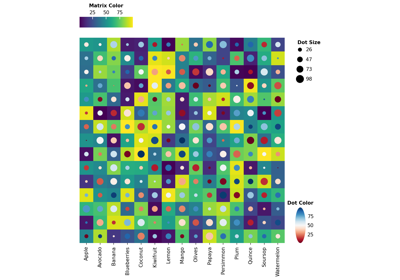
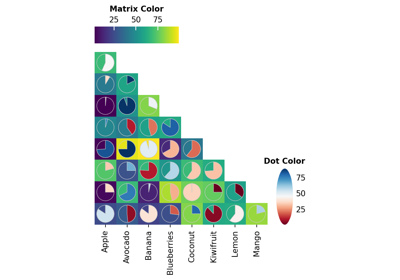
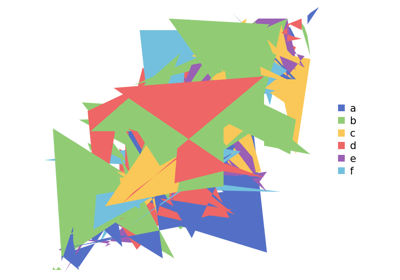
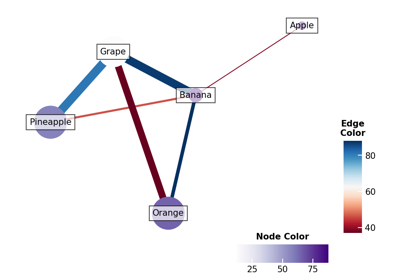
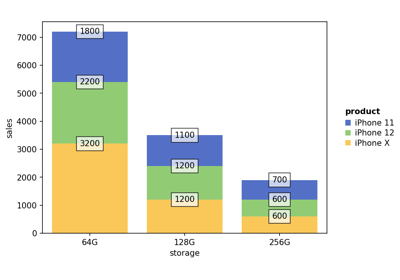
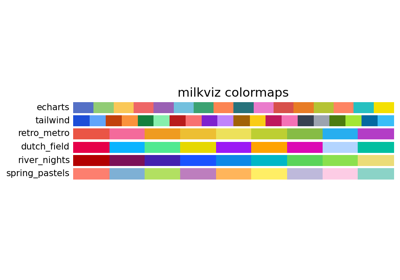
Gallery# Below shows a series of visualization example Point map Example (Continuous data) Point map Example (Continuous data) Point map 3D Example (Categorical data) Point map 3D Example (Categorical data) Bubble plot Example Bubble plot Example Point map Example (Categorical data) Point map Example (Categorical data) Annotated heatmap Example Annotated heatmap Example Dot plot Example Dot plot Example Dot heatmap Example Dot heatmap Example Venn diagram 2 & 3 Example Venn diagram 2 & 3 Example Upset plot Example Upset plot Example Dot heatmap + Matrix heatmap Example Dot heatmap + Matrix heatmap Example Triangle Dot heatmap Example Triangle Dot heatmap Example Polygon map Example Polygon map Example Graph plot Example Graph plot Example Stacked bar Example Stacked bar Example Custom colormap in milkviz Custom colormap in milkviz Gallery generated by Sphinx-Gallery