Note
Click here to download the full example code
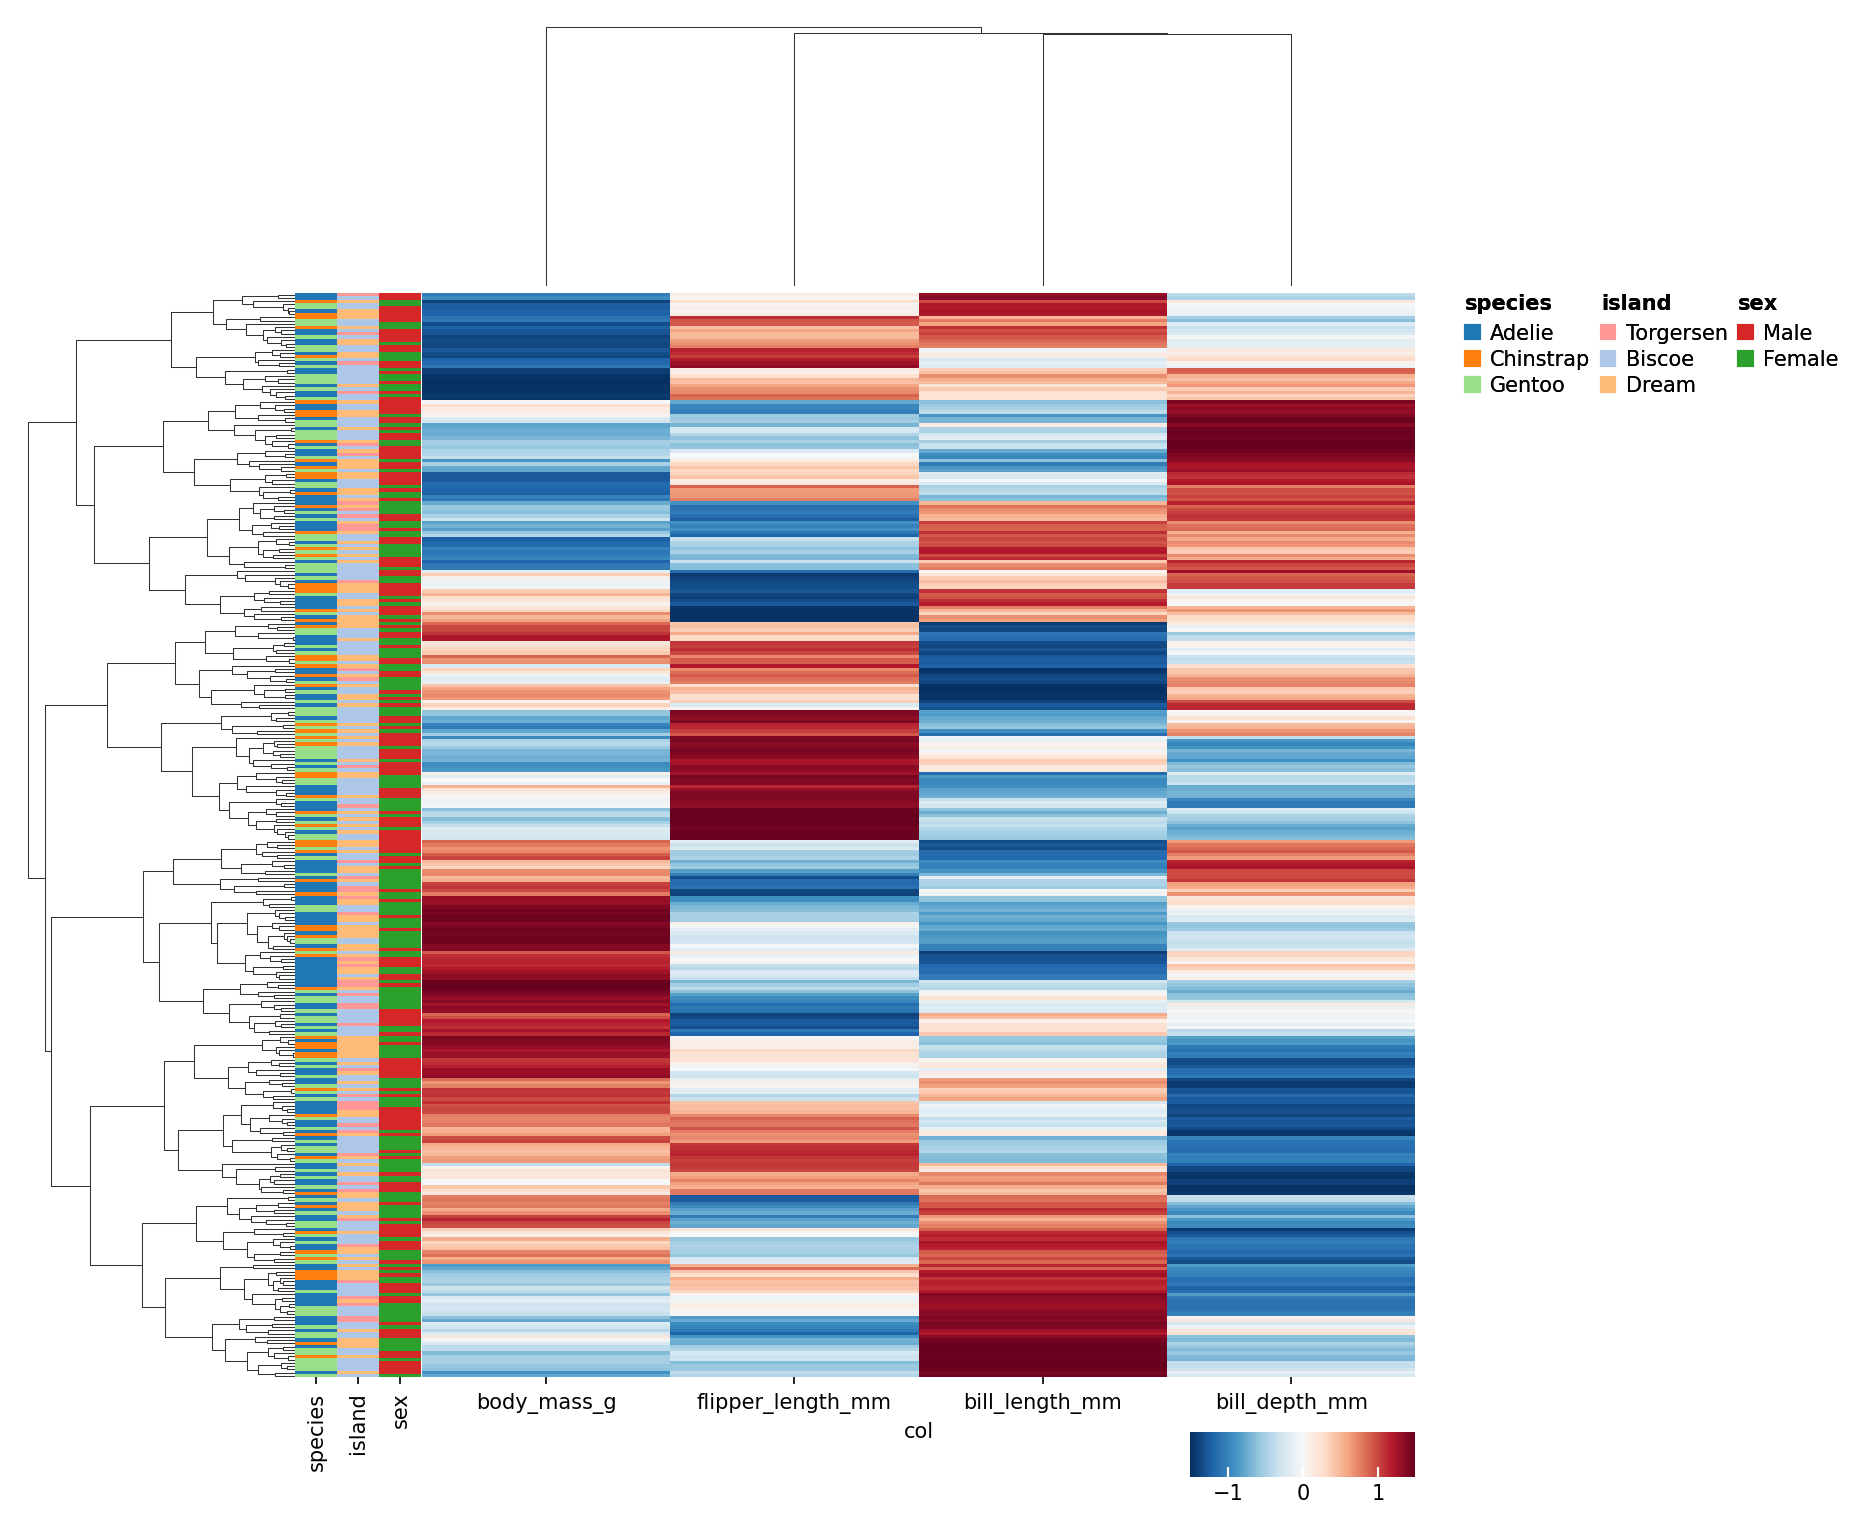
Annotated heatmap Example#
Here shows how to draw annotated heatmap
import numpy as np
import pandas as pd
import milkviz as mv

np.random.seed(0)
First let’s create some random data#
import seaborn as sns

p = sns.load_dataset("penguins").dropna()
df = p.set_index(["species", "island", "sex"])
data = np.random.randn(*df.to_numpy().shape)
df = pd.DataFrame(data=data, columns=df.columns, index=df.index)
df.columns.name = "col"
df
Create the heatmap#
mv.anno_clustermap(df, row_colors=["species", "island", "sex"],
                   col_label="col", z_score=0)
<seaborn.matrix.ClusterGrid object at 0x7f2cc233aca0>
Total running time of the script: ( 0 minutes 2.380 seconds)