Note
Click here to download the full example code
Point map Example (Categorical data)#
Here shows how to draw the point map
import numpy as np
import milkviz as mv
First let’s create some random data#
np.random.seed(0)
xy = np.random.randint(0, 100, (1000, 2))
types = np.random.choice(list("abcdefg"), 1000)
Create the point map#
mv.point_map(xy, types=types,
             legend_kw={"title": "Type", "ncol": 2})
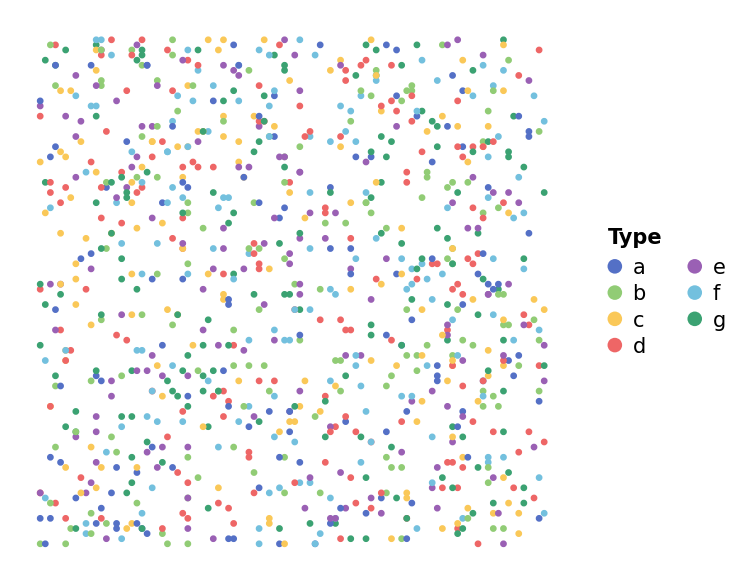
<AxesSubplot: >
It’s possible to add some links#
links = [np.random.choice([i for i in range(1000)], 2) for _ in range(50)]
mv.point_map(xy, types=types, links=links,
             legend_kw={"title": "Type", "ncol": 2})
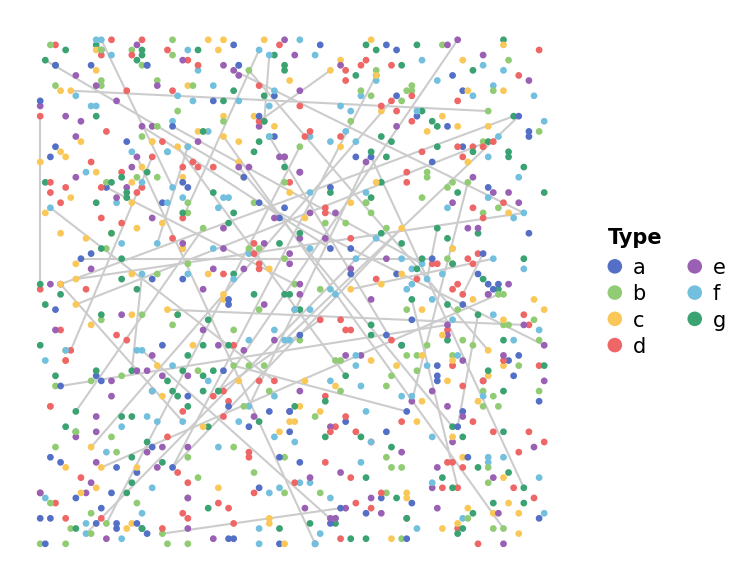
<AxesSubplot: >
Total running time of the script: ( 0 minutes 0.830 seconds)