Note
Click here to download the full example code
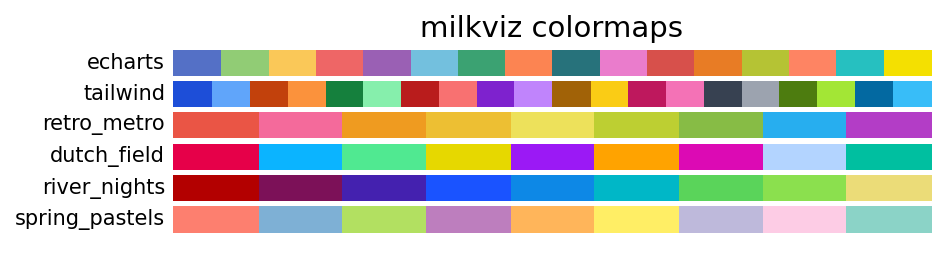
Custom colormap in milkviz#
Currently, I made 6 categorical colormap
echarts (16): Taken from Echarts.js v5.0
tailwind (20): Taken from TailwindCSS v3.0
retro_metro (9)
dutch_field (9)
river_nights (9)
spring_pastels (9)
import numpy as np
import matplotlib.pyplot as plt
import milkviz as mv


gradient = np.linspace(0, 1, 256)
gradient = np.vstack((gradient, gradient))


def plot_cmap(cmap_list):
    # Create figure and adjust figure height to number of colormaps
    nrows = len(cmap_list)
    figh = 0.35 + 0.15 + (nrows + (nrows - 1) * 0.1) * 0.22
    fig, axs = plt.subplots(nrows=nrows + 1, figsize=(6.4, figh))
    fig.subplots_adjust(top=1 - 0.35 / figh, bottom=0.15 / figh,
                        left=0.2, right=0.99)
    axs[0].set_title(f'milkviz colormaps', fontsize=14)

    for ax, name in zip(axs, cmap_list):
        ax.imshow(gradient, aspect='auto', cmap=plt.get_cmap(name))
        ax.text(-0.01, 0.5, name, va='center', ha='right', fontsize=10,
                transform=ax.transAxes)

    # Turn off *all* ticks & spines, not just the ones with colormaps.
    for ax in axs:
        ax.set_axis_off()
milkviz’s colormap#
plot_cmap(["echarts", "tailwind", "retro_metro",
           "dutch_field", "river_nights", "spring_pastels"])
Total running time of the script: ( 0 minutes 0.453 seconds)