Note
Click here to download the full example code
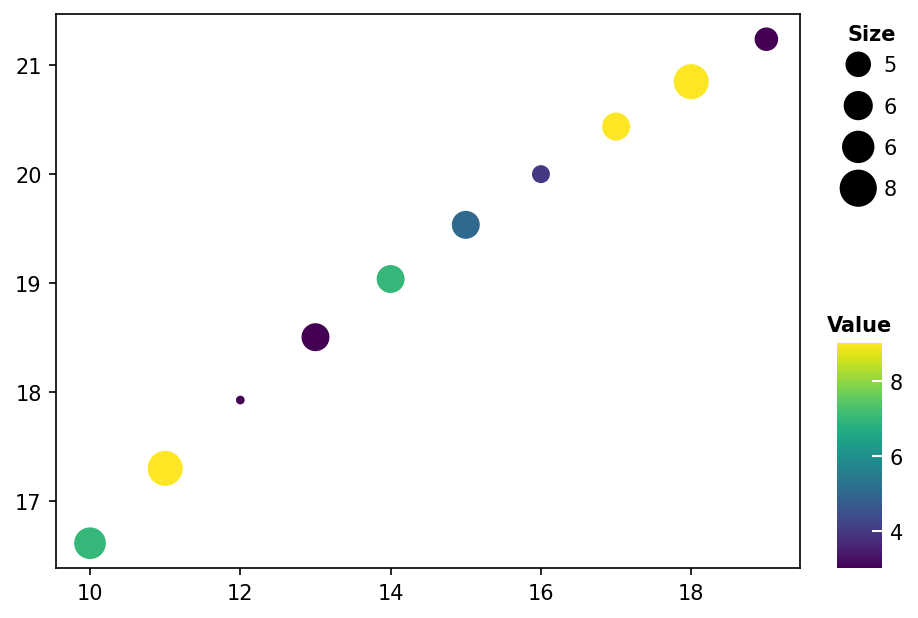
Bubble plot Example#
Here shows how to draw dot plot
import numpy as np
import milkviz as mv
First let’s create some random data#
np.random.seed(0)
x = np.arange(10, 20)
y = np.log2(x) * 5
size = np.random.randint(3, 10, 10)
color = np.random.randint(3, 10, 10)
Create the dot heatmap#
mv.bubble(x=x, y=y, size=size, hue=color,
          legend_kw={"title": "Size"}, cbar_kw={"title": "Value"})
<AxesSubplot: >
Total running time of the script: ( 0 minutes 0.533 seconds)