Note
Click here to download the full example code
Venn diagram 2 & 3 Example#
Here shows how to draw venn diagram
import numpy as np
import pandas as pd

import milkviz as mv
Data input for venn diagram#
There are three types of data input
Specific a list of sets
Specific a list of list, intersections between lists will be computed for you, duplicates will considred
A list of number denotes the regions in venn diagram in the following order: venn2 used (10, 01, 11) or venn3 used (100, 010, 110, 001, 101, 011, 111)
np.random.seed(0)
list_sets = [set([1,2,3,4,5,13,100]),
             set([4,5,6,7,8,100,101]),
             set([4,5,10,11,12,13,101])]
list_list = [np.random.randint(0, 20, 10),
             np.random.randint(0, 20, 30),
             np.random.randint(0, 20, 15)]
list_area = (1, 1, 1, 2, 1, 2, 2)
Create venn2#
mv.venn([set([1,2,3,4]), set([4,5,6,7])])
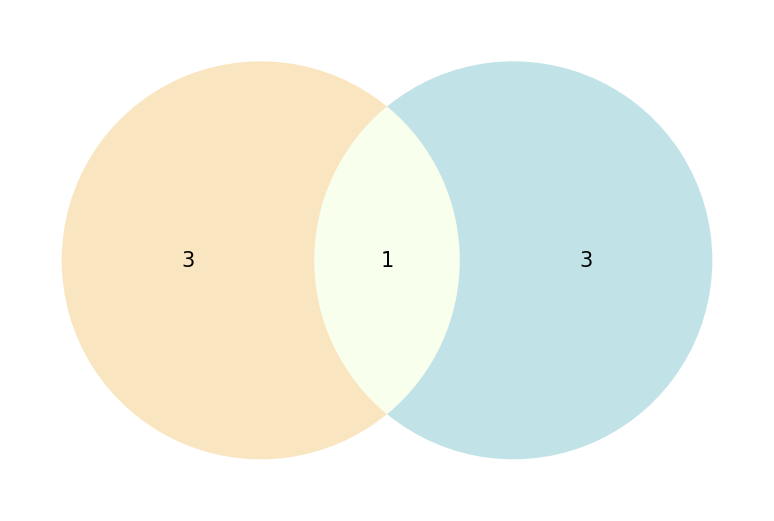
<AxesSubplot: >
Create the venn with set#
mv.venn(list_sets, names=['A', 'B', 'C'])
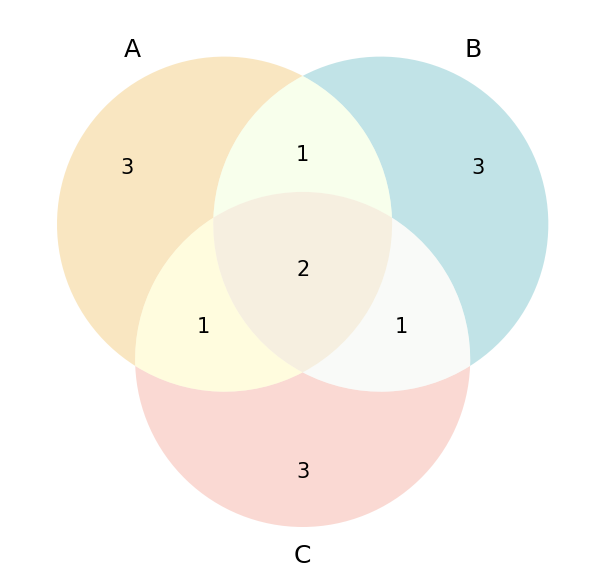
<AxesSubplot: >
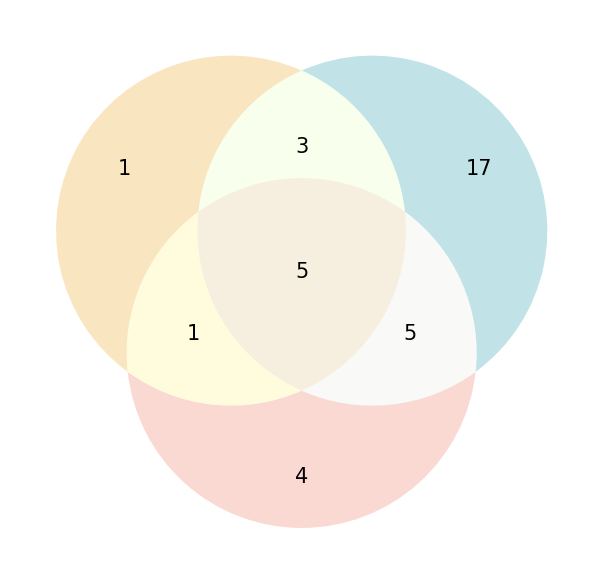
Create the venn with list#
mv.venn(list_list)
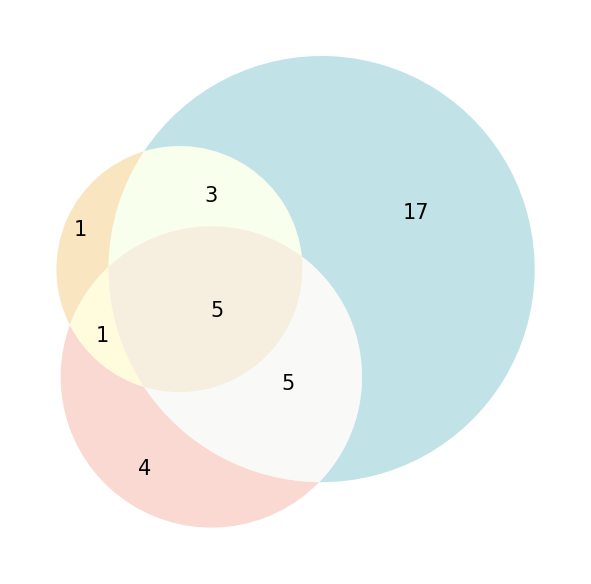
<AxesSubplot: >
Create the venn with area#
mv.venn(list_area)
<AxesSubplot: >
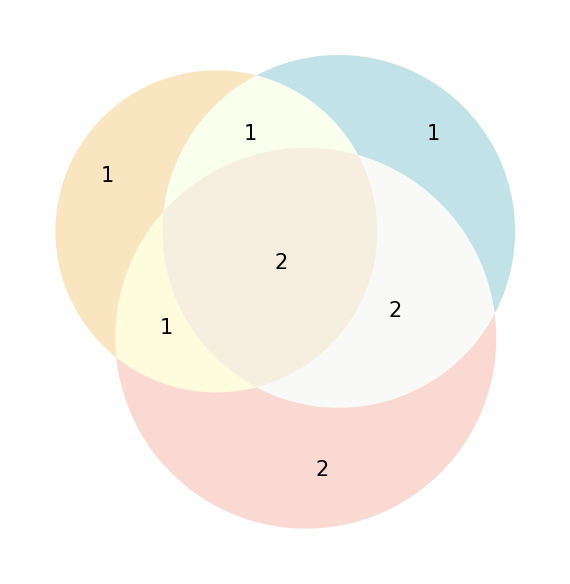
Create unweighted venn#
mv.venn(list_list, weighted=False)
<AxesSubplot: >
Total running time of the script: ( 0 minutes 1.881 seconds)