Note
Click here to download the full example code
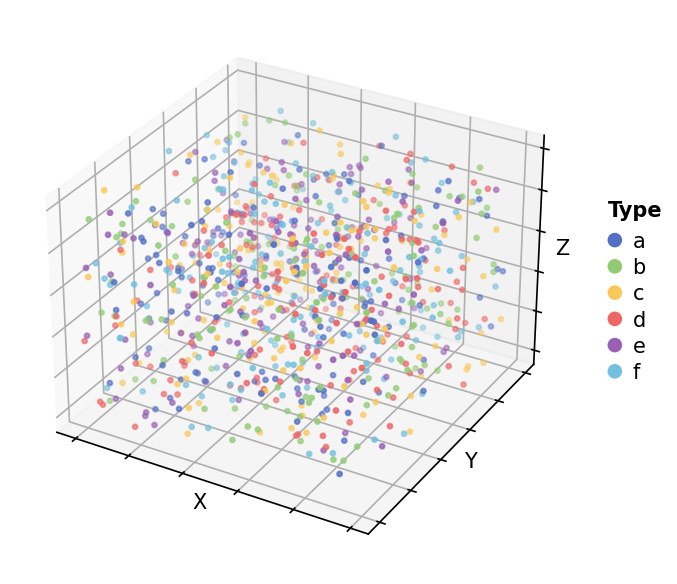
Point map 3D Example (Categorical data)#
Here shows how to draw the point map in 3D
import numpy as np
import milkviz as mv
First let’s create some random data#
np.random.seed(0)
xyz = np.random.randint(0, 100, (1000, 3))
types = np.random.choice(list("abcdef"), 1000)
Create the point map#
mv.point_map(xyz, types=types, legend_kw={"title": "Type"})
<Axes3DSubplot: xlabel='X', ylabel='Y', zlabel='Z'>
Total running time of the script: ( 0 minutes 0.597 seconds)